March 12th, 2024
Understanding and Analyzing Bivariate (Pearson) Correlation
By Josephine Santos · 8 min read
Overview
Bivariate Correlation is a fundamental concept in the realm of statistics. Its origins trace back to 1561, predating many contemporary statistical tests. Stemming from the Latin term "correlation," it signifies a relationship. Essentially, correlation delves into the interconnectedness of two or more events or phenomena. Questions like: Does prolonged sun exposure increase skin cancer risk? Does museum satisfaction influence repeat visits? Is there a correlation between age and income? Are wages and inflation interconnected? Does a surge in oil prices affect shipping costs? It's crucial to note that while correlation indicates a relationship, it doesn't necessarily mean one causes the other. The correlation coefficient, often denoted as 'r', quantifies this relationship, ranging from -1 to +1.
Pearson’s r, or the Pearson product-moment correlation coefficient, is used to measure the correlation between two continuous variables. A positive 'r' suggests a direct relationship (as A increases, so does B), whereas a negative 'r' indicates an inverse relationship (as A increases, B decreases). An 'r' value of zero denotes no discernible relationship. However, it's worth noting that Pearson’s r is confined to linear relationships, and a zero value doesn't rule out potential non-linear correlations.
Applying Bivariate (Pearson) Correlation Using SPSS
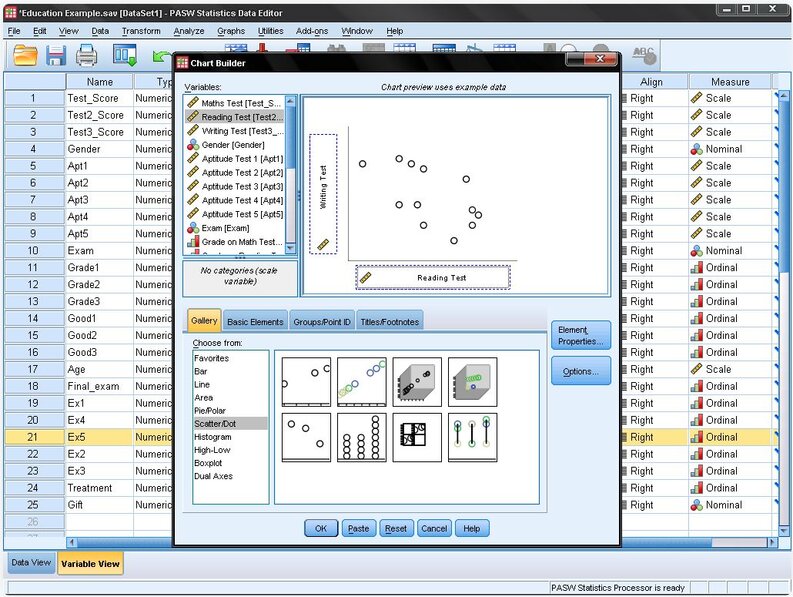
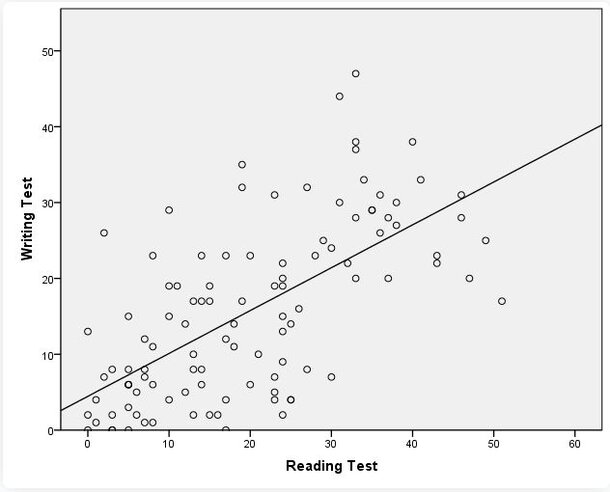
SPSS is a popular statistical software for understanding and analyzing bivariate correlation. Before delving into the analysis, it's advisable to plot a scatter graph to visually assess the relationship between two variables, say reading and writing test scores. This step ensures the relationship is linear, as Pearson’s Correlation Analysis might overlook non-linear relationships, leading to potential errors.
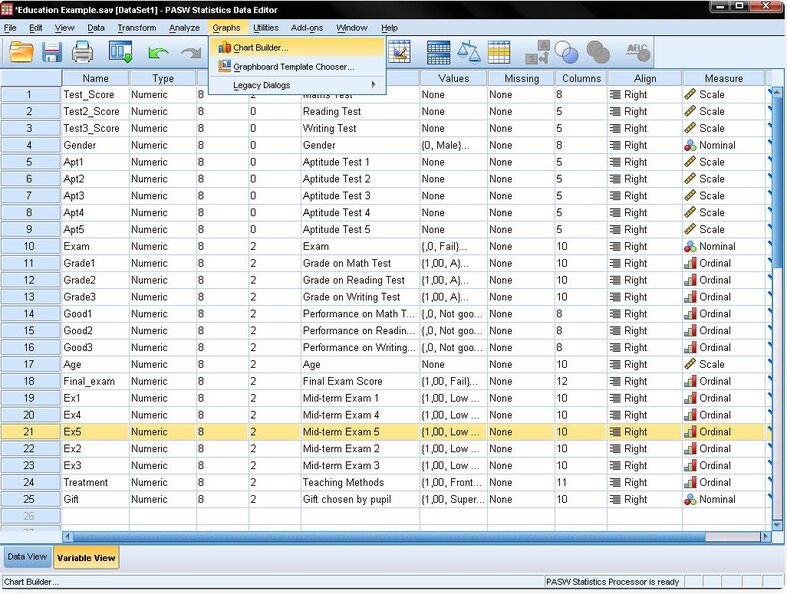
To generate a scatter plot in SPSS, navigate to Graphs/Chart Builder… or Graphs/Legacy Dialog/Scatter Dot…

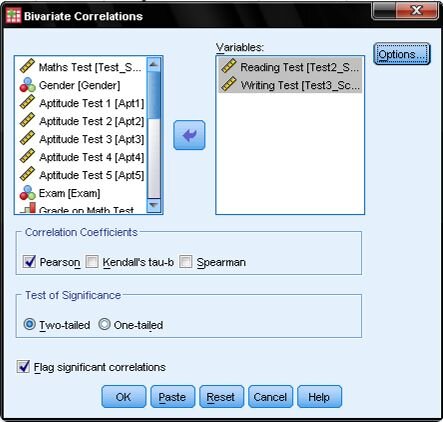
For this analysis, we'll select Pearson’s correlation coefficient. Under the Test of Significance, opt for the two-tailed test, as we're not pre-assuming the nature (positive or negative) of the correlation between Reading and Writing. Retain the default setting to flag significant correlations, which will highlight correlation coefficients with p<0.05 in the SPSS output.
In essence, the correlation coefficient, Pearson’s r, offers a snapshot of the relationship strength between two continuous variables. It's a valuable tool, but users should be aware of its limitations, especially when it comes to non-linear relationships.
If you don't have SPSS...
In wrapping up our exploration of Bivariate (Pearson) Correlation, it's evident that understanding the relationship between two variables is crucial in many research scenarios. While tools like SPSS have traditionally been the go-to for such analyses, the emergence of platforms like Julius.ai offers a more intuitive and streamlined approach. With Julius.ai, not only can you efficiently conduct and interpret your correlation analyses, but you also benefit from a suite of advanced features tailored for the modern researcher. Embrace the future of data analysis with Julius.ai and elevate your research endeavors.
