June 5th, 2024
The Role of Scatter Plots in Regression Analysis
By Zach Fickenworth · 8 min read

Overview
In the realm of data analysis skills, particularly regression analysis, scatter plots play a pivotal role. They are not just simple graphs; they are powerful tools for validating assumptions critical to the accuracy and reliability of regression analysis. This blog delves into the importance of scatter plots, specifically residual scatter plots, in regression analysis and how tools like Julius can aid in this process.
Understanding Scatter Plots in Regression Analysis
A scatter plot is a type of data visualization that represents the values of two different variables on two axes, allowing researchers to observe relationships between them. In the context of regression analysis, scatter plots, especially residual scatter plots, are instrumental in examining the assumption of homoscedasticity.
Homoscedasticity and Its Importance
The Residual Scatter Plot: A Visual Tool for Assumption Checking
1. Outlier Detection: It helps in identifying outliers or extreme scores in the dataset, which can significantly impact the regression analysis.
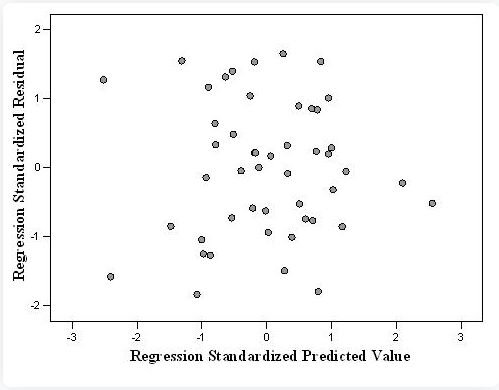
2. Assumption Validation: As Tabachnick and Fidell (2007) noted, the plot allows for a quick visual check of homoscedasticity. If the residuals are evenly distributed across all predicted scores, forming a roughly rectangular shape around the zero point, the assumption of homoscedasticity is met.
3. Identifying Violations: Any systematic pattern or clustering of scores on the plot indicates a violation of the homoscedasticity assumption.
Example of a Residual Scatter Plot

How Julius Can Assist
Julius, an AI graph maker, can significantly enhance the utility of scatter plots in regression analysis:
- Automated Plot Generation: Julius can quickly generate residual scatter plots, saving time and reducing the potential for human error.
- Outlier Identification: It can identify and flag outliers, helping researchers decide whether to include or exclude them from the analysis.
- Assumption Checks: Julius provides an automated check for homoscedasticity, offering a quick and reliable way to validate this crucial assumption.
- Data Interpretation: It offers clear interpretations of scatter plot patterns, aiding researchers in understanding their implications for the regression analysis.
