March 26th, 2024
Demystifying the Assumptions of Linear Regression
By Zach Fickenworth · 6 min read

Overview
Linear regression is a powerful statistical tool that allows researchers to examine the relationship between two or more variables. However, for the results to be reliable, certain assumptions must be met. In this article, we'll delve deep into the assumptions of linear regression and provide insights on how to ensure your data meets these criteria.
Understanding Linear Regression
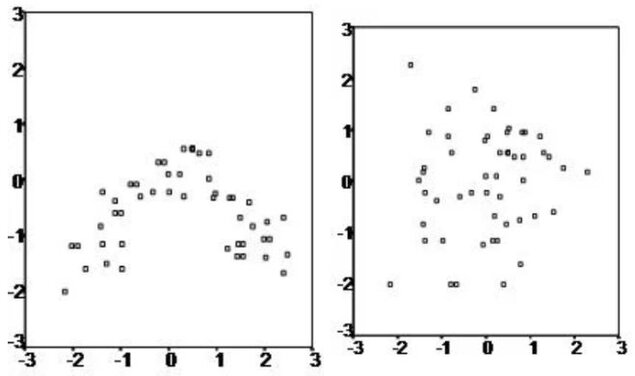
The Five Key Assumptions of Linear Regression

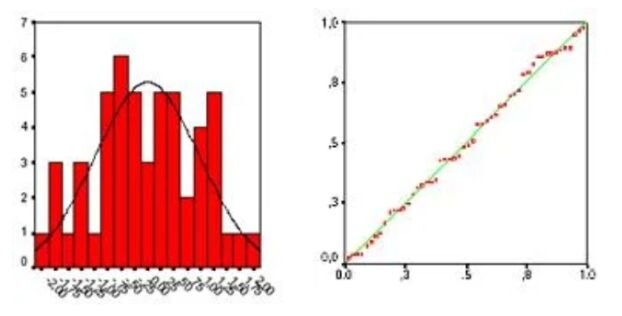
2.) Multivariate Normality: All variables should be multivariate normal. This means that the distribution of residuals (unexplained variance) should be normally distributed. Histograms or Q-Q plots can help visualize this. If your data isn't normally distributed, consider a non-linear transformation, like a log-transformation.

- Correlation Matrix: Correlation coefficients should be smaller than 1.
- Tolerance: Defined as T = 1 – R², values below 0.1 might indicate problematic multicollinearity.
- Variance Inflation Factor (VIF): A VIF above 5 suggests multicollinearity might be present, and above 10 indicates definite multicollinearity.
If multicollinearity is detected, consider centering the data or removing variables with high VIF values.
4.) No Auto-correlation: Autocorrelation occurs when residuals are not independent of each other. For instance, in stock prices, today's price might be closely related to yesterday's. The Durbin-Watson test can help detect autocorrelation. Values around 2 suggest no autocorrelation, while a rule of thumb is that values between 1.5 and 2.5 are relatively safe.

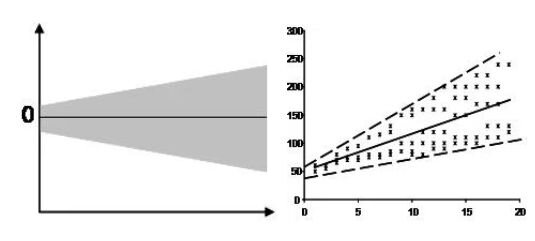
5.) Homoscedasticity: This assumption implies that the residuals exhibit constant variance across the regression line. Scatter plots can help visualize this. If the plot shows a funnel shape, it suggests heteroscedasticity. The Goldfeld-Quandt Test is another tool to detect this. If detected, a non-linear correction might be necessary.

Modern Software and Linear Regression
With advancements in statistical software, conducting a linear regression analysis has become more straightforward. Many of the assumptions come preloaded, and the software can interpret them for you. However, it's always essential to understand these assumptions, as they underpin the reliability of your regression analysis.
Conclusion
Linear regression is a versatile tool in the researcher's toolkit, but its reliability hinges on the assumptions being met. By understanding and checking for these assumptions, you can ensure that your findings are both accurate and meaningful. Whether you're a seasoned researcher or just starting, always remember the importance of these assumptions and the role they play in the world of linear regression.
Having navigated the complexities of linear regression and its assumptions, it's clear that the analytical journey requires precision and clarity. While the foundational knowledge is indispensable, the tools we use can elevate our analyses to new heights. After concluding our deep dive into regression, it's time to introduce a game-changer: Julius.ai. This state-of-the-art platform is tailored to streamline and optimize your regression tasks, ensuring you're not just analyzing, but analyzing smarter.
