April 8th, 2024
Deciphering the Chi-Square Goodness of Fit Test
By Josephine Santos · 8 min read

Overview
In the vast realm of statistical analysis, the Chi-Square Goodness of Fit Test stands out as a powerful tool for understanding how observed data aligns with expected data distributions. Whether you're a researcher, data analyst, or student, understanding this test can provide valuable insights into your data.
What is the Chi-Square Goodness of Fit Test?
Breaking Down the Procedure
1. Setting Up the Hypothesis:
- Null Hypothesis (H0): Assumes that there's no significant difference between observed and expected values.
- Alternative Hypothesis (H1): Assumes a significant difference between observed and expected values.
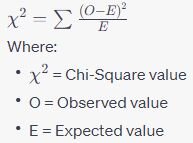
2.Computing the Chi-Square Value: The test statistic is calculated using the formula:

- Binomial Distribution: n-1
- Poisson Distribution: n-2
- Normal Distribution: n-3
4. Hypothesis Testing: After calculating the Chi-Square value, it's compared to a critical value from the Chi-Square distribution table. If the calculated value exceeds the table value, the null hypothesis is rejected, indicating a significant difference between observed and expected frequencies. Conversely, if the calculated value is less, the null hypothesis is accepted.
Why is the Chi-Square Goodness of Fit Test Important?
This test is particularly valuable in scenarios where we want to validate theoretical distributions against actual data. For instance, if a company expects a certain distribution of product sales across regions and wants to verify if the actual sales match those expectations, the Chi-Square Goodness of Fit Test can provide clarity.
How Julius.ai Can Streamline Your Chi-Square Analysis
While understanding the Chi-Square Goodness of Fit Test is essential, having a reliable tool to execute this test can significantly simplify the process. This is where Julius.ai comes into play.
- Efficiency: With Julius.ai, you can quickly input your observed and expected data and get instant results without manual calculations.
- Visualization: Julius.ai offers dynamic visualization options, helping you better understand and present your Chi-Square results.
- Guidance: If you're new to Chi-Square or need a refresher, Julius.ai performs and outlines the process for you, allowing you to learn as it does all the difficult parts of the work!
In the world of data analysis, accuracy and efficiency are paramount. With Julius.ai, you get both, ensuring that your Chi-Square Goodness of Fit analyses are both precise and streamlined.
By integrating the Chi-Square Goodness of Fit Test into your analytical toolkit and leveraging platforms like Julius.ai, you're well-equipped to draw meaningful insights from your data, validate theoretical distributions, and make informed decisions.
