July 10th, 2024
What Is Data Analysis? Your In-Depth Guide
By Rahul Sonwalkar · 12 min read
Data analysis is quickly becoming one of the most needed and recognized fields across the globe.
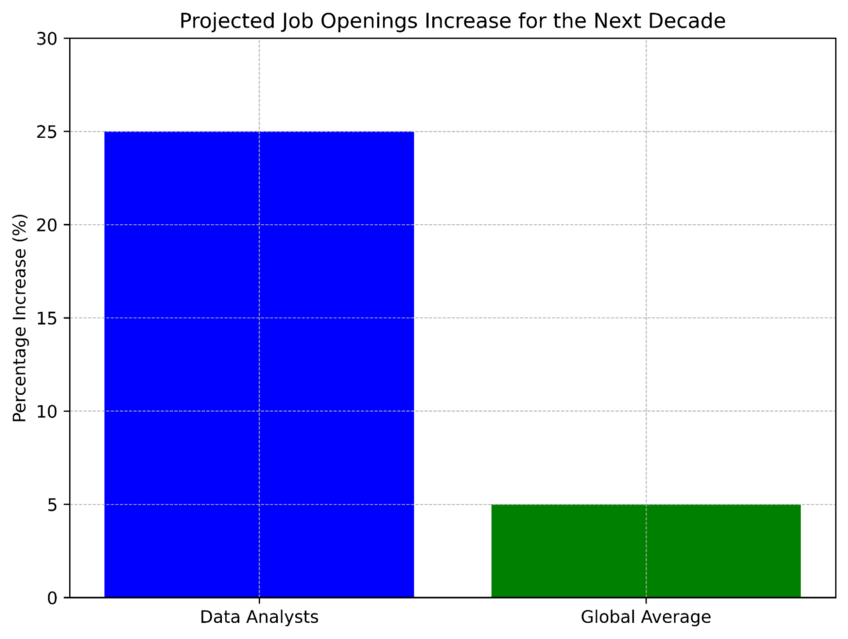
In fact, according to the U.S. Bureau of Labor Statistics, data analysts are among the most lucrative positions today, with expected job openings likely to increase by a quarter in the coming decade. This is a significant increase compared to the global average of job openings – only 5%.

Bar chart depicting the difference of job openings for Data Analyst roles compared to the average role. Created with Julius AI
With the growth of data and data analysis, let’s dive into what data analysis is and why it’s important for you (and everyone) today.
Defining Data Analysis
Data analysis is practically as old as writing, interpreting written, physically tangible information. But modern technology has leapfrogged the field to mostly refer to digital data. In stricter terms, today’s definition of data analysis is a comprehensive methodology of extracting, cleaning, interpreting, transforming, modeling, and visualizing information from datasets.
It’s the last part of the discipline of data analytics, which is a broader process of information management and includes collection, storage, and organization. It focuses on turning information that might not seem useful at first glance into actionable insights.
Why Is Data Analysis Important Today?
As mentioned, the concept of analyzing data has been evident throughout history. When people had something to store and use, they needed statistics to manage the information at their disposal.
However, the amount of information available today is something that humans simply can’t fathom. According to some estimates, roughly 90% of all data has been created in the past two years. For that reason, businesses that need to place their services and products on the market must have near-immediate access to timely information.
Furthermore, they need a way to properly turn that data into something they can use. And that’s precisely where modern data analysis processes shine. It helps businesses develop better products, improve customer experience, streamline internal processes, and navigate complex global supply chains, all in the name of increasing profits.
Data Analysis Process
Analyzing data is a somewhat complex systematic process applied to one or more data sets. To better understand its nuances, it can be helpful to break it down into sequential steps.
Step 1: Identify Objectives
Companies need to have a clear overview of the problem they’re trying to solve or questions they need to be answered in order for data analysis to make sense. Without a goal, analyzing incredible amounts of data can only provide a partial picture at best. During identification, it also helps to acknowledge and implement key performance indicators based on the data you want to use to get actionable goals.
Step 2: Collect Data
Although technically the process of data analysis doesn’t involve collecting the data itself (as it’s a part of the broader data analytics field), it’s often bulked together with analysis due to their codependence. Information collection can be performed in multiple ways, through surveys, interviews, polls, observations, extraction from existing datasets, or even purchasing data from other sources.
Step 3: Clean Datasets
Not all information collected by a company is immediately useful. Cleaning this data includes removing duplicate or obsolete information, eliminating inconsistent or anomalous points, and standardizing formatting and data structures for further use. It ensures that the data is reliable so analyzing it yields accurate insights.
Step 4: Analyze Data
After the database is cleaned of errors and extraneous information, the actual process of analyzing it can begin. This can be done through various statistical and mathematical methodologies that discover patterns and trends or build relationships between data points. Most often, analyzing data is done through software solutions that can apply transformative functions and data analysis techniques to vast and complex datasets.
Step 5: Interpret Results
With the information analyzed, data visualization tools can turn it into more human-readable formats such as graphs, tables, and maps. This helps you extract conclusions from the available dataset. This harks back to the goals made in the first step. The data can now be compared to the KPIs set in the goals, allowing decision-makers to carve a path forward that is supported by empirical results.
Essential Types of Data Analysis
Information can be used in various ways, and the types of data analysis can similarly vary. Overall, there are dozens of types of analyzing data, including:
- Statistical analysis is the broadest term for applying mathematical relationship formulas to existing datasets to extract information from large data populations, such as deviation, averages, expected results, confidence intervals, and sampling protocols.
- Regression analysis looks into relationships between the surveyed outcome and one or more independent variables, which can also be used to predict results based on how the independent variables change.
- Descriptive analysis summarizes and describes the main features and talking points from a dataset, providing useful overviews of historical events and information through statistical analysis
- Diagnostic analysis explores the cause behind data point relationships, using regression analysis to create correlation and causation hypotheses.
- Predictive analysis uses historical data to create models and projections of future objectives and relationships.
- Prescriptive analysis creates recommendations from guidelines and information made by other types of data analysis, allowing companies to act based on empirical evidence.
Data Analysis Examples and Applications
Due to being such an indispensable tool for companies, data analysis has been used in pretty much any industry that can collect and store historical data.
Healthcare
Diagnosing patients is heavily dependent on analyzing existing data from customer records to medical imaging, with more recent models using predictive and prescriptive analysis from machine learning algorithms.
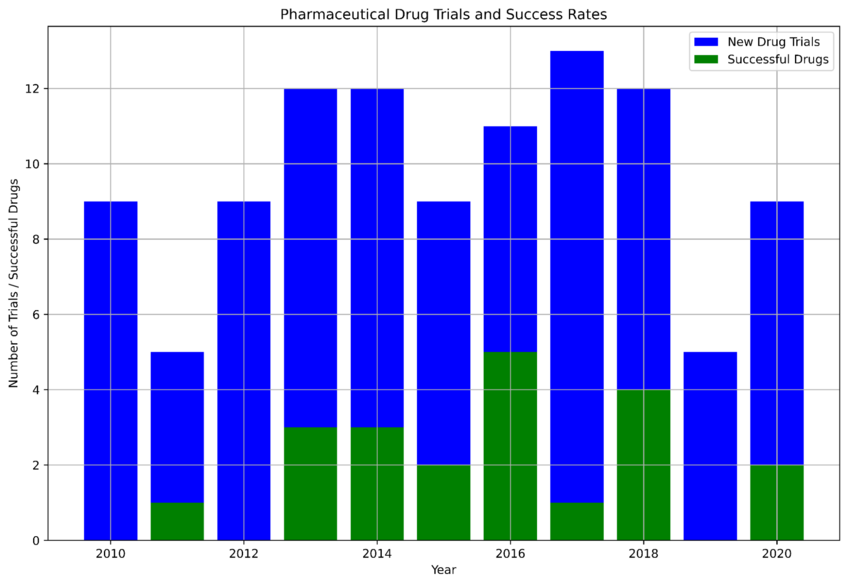
Pharmaceutical companies use data analytics to determine new potential drugs, their efficacy, and interpret the results of clinical trials. Finally, genome analysis techniques help create personalized treatment plans by predicting risks of disease and drug susceptibility.

Example chart depicting the trends in pharmaceutical research, highlighting the number of trials conducted each year and the success rate of these trials in producing viable drugs. Created with Julius AI
Business and Marketing
Data analytics are a vital part of market research, allowing companies to understand market trends and consumer preferences so they can develop and price their products. The process is also pivotal in predicting future sales by leveraging historical data such as seasonal variations and potential for demand.
Finance
Data analysis is a key part of making trading algorithms, allowing the stock market to operate seemingly without much human input. Financial institutions also use historical data to perform risk detection and management with applications for determining credit scores, loan rates, predicting market risks, and detecting fraud.
Manufacturing and Warehousing
Businesses that manufacture products use data analysis to determine product quality but also how much stock they need to carry to meet market demands. This helps reduce overhead costs, ensure timely deliveries, and mitigate supply chain issues.
Internet and Social Media
Search engines and social media platforms use data analytics to determine what users are interested in and the intent behind their search terms. The engine also crawls through websites to rank them based on relevance, authority, and trustworthiness. The concepts are then collated into recommendation algorithms.
AI
Large language models and artificial intelligence rely on analyzing huge swaths of data to infer relationships and create outputs. For example, chat AIs predict words based on historical context and relevance to the topic, using their training data to extract patterns from natural languages.
Data Analysis Trends
The rising role of AI and machine learning has the potential to automate many analytical processes and make more accurate predictions based on large datasets. This means that companies will be able to get access to high-grade data analysis tools without needing dedicated data analysts in-house to use them.
With data collection becoming more prevalent due to the sheer amount of information created each day, privacy concerns and ethical data handling have been more important than ever. Regulations like GDPR aim to promote more transparent data collection and analysis techniques, allowing internet users to regain some of their anonymity.
Quantum computing is also one of the more promising developments for data analysis. Due to its ability to solve niche complex problems, quantum computers can be used to supplement existing techniques and make the process even more reliable.
Leverage Julius AI to Make Your Data Analysis Better
With so much variety in data analysis techniques, it might look daunting to start learning how to interpret the data you have. Luckily, you don’t have to go through the process alone.
Use Julius AI to streamline your data analysis journey. The AI tool can process your queries and datasets, allowing you to present key questions and get meaningful insights. You don’t need to have direct knowledge of data analysis. Just ask the AI a question about your information and get immediate answers.
Frequently Asked Questions (FAQs)
What is the 5 Whys technique?
The 5 Whys technique is a problem-solving method that involves asking "Why?" five times (or as many as needed) to uncover the root cause of an issue. It’s a simple and effective tool for identifying underlying problems by peeling back layers of symptoms, often used in lean manufacturing and quality improvement processes.
What is 5C analysis method?
The 5C analysis method is a strategic framework used to evaluate a company’s operating environment by focusing on five key areas: Company, Customers, Competitors, Collaborators, and Climate. This method provides a comprehensive view of both internal and external factors that influence business decisions, making it valuable for strategic planning and market analysis.
What is end-to-end data analysis?
End-to-end data analysis refers to the complete process of working with data, from collection and cleaning to transformation, analysis, and visualization. It ensures a seamless flow of data insights, enabling businesses to make informed decisions by addressing every step of the analytical pipeline comprehensively.
